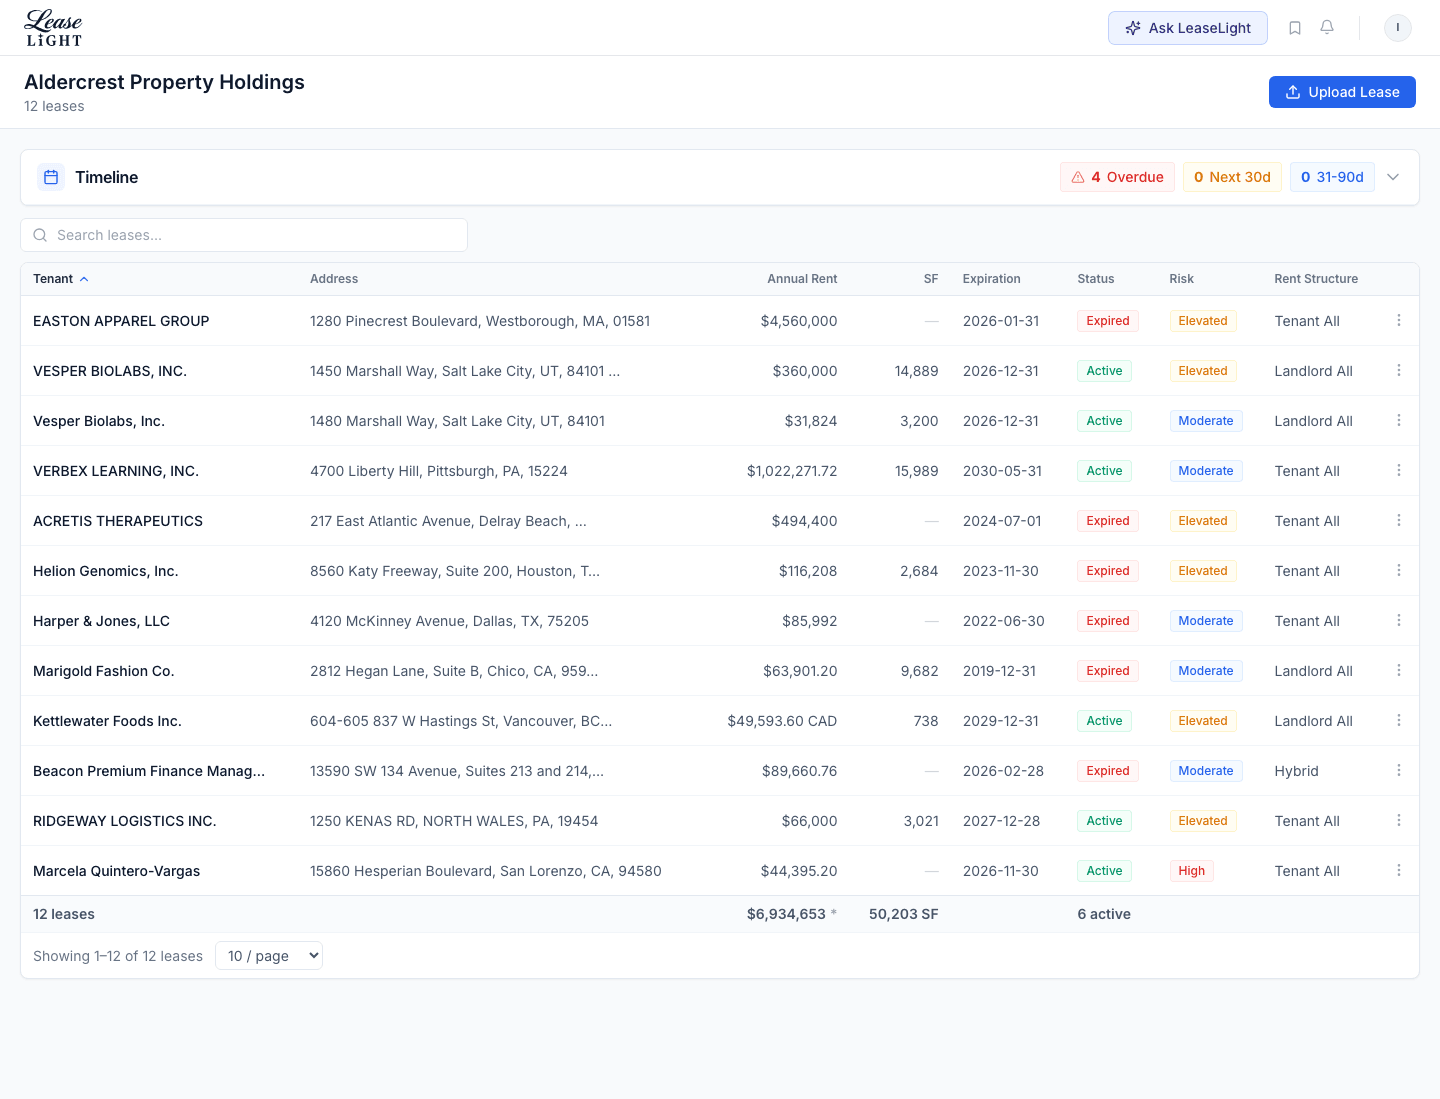
See what your lease portfolio is hiding.
LeaseLight reviews leases, amendments, and clauses; surfaces hidden costs, options, obligations, and risk; and links material findings to the exact source in the document.
Built for CRE teams walking into IC, renewal, ownership, refinance, budget, or operations meetings with answers they can defend.
Built for the team picking up the lease.
The same lease stack hides different problems depending on who is holding the risk.
Acquisitions & Asset MgmtWhat's hiding under the rent roll?
+
What's hiding under the rent roll?
- Where could WALT or rollover exposure change the underwriting?
- Which options has the tenant quietly accumulated?
- What landlord obligations could blow up my pro-forma?
- Where do leases contradict each other in this asset?
- Which leases look above or below expectations based on their structure, escalations, and obligations?
- What's the holdover leverage in this rent roll?
- Where does subordination/estoppel friction sit before refinancing?
Embedded Optionality Scan · Landlord Obligation Liability Mapping · NOI Waterfall · Lease-to-Lease Contradiction Finder
Operators Managing Leased LocationsWhat's costing you that you can't see?
+
What's costing you that you can't see?
- Which costs deserve review?
- Where are percentage-rent breakpoints approaching unnoticed?
- What audit rights are you sitting on but not exercising?
- Which CAM audits have the strongest lease-language basis?
- Where do co-tenancy or exclusivity violations deserve review?
- What renewal leverage do you actually have, location by location?
- Which leases are missing protections your other leases have?
Hidden Cost Discovery · OpEx Audit Opportunity Finder · Renegotiation Leverage Scorecard · Co-Tenancy & Exclusivity Violation Monitor
Property ManagersWhat's about to surprise your owner?
+
What's about to surprise your owner?
- Which expiration cluster is about to destabilize this asset?
- Where is operating-expense recovery language under-collecting vs. lease intent?
- Which deferred-maintenance obligations land on the landlord?
- Which tenants are highest retention risk based on lease terms, not vibes?
- Where do same-building tenants have materially inconsistent terms?
- Which percentage-rent tenants are approaching breakpoints?
- What environmental or hazmat liability sits in your lease stack?
Revenue Cliff Detector · OpEx Passthrough Optimization · Deferred Maintenance Liability Extraction · Environmental & Hazmat Liability Map
Portfolio-level decisions
For deal teams and asset owners reviewing concentration, NOI support, recoveries, and control rights before IC, refi, buyer, or lender review.
Portfolio reports answer the first questions a deal team asks: where rent is concentrated, what supports the NOI line, where recovery thins, and which control rights are missing. Each answer stays tied to the lease text behind it.
- Lease-backed charts
- Every chart ties back to the leases and extracted fields behind the numbers.
- Coverage transparency
- Where data thins, the report marks the gap instead of smoothing it.
- Review framing
- Findings show the next IC, lender, or refi question without treating the result as a settled outcome.
- Portfolio patterns
- Rent clusters, recovery gaps, and missing rights surface across the lease set.
- NOI discipline
- Sensitivities stay separate from in-place NOI; dollars stay out until the lease text supports them.
Each example opens the chart, the tenants behind it, the lease support, and the next question to review.
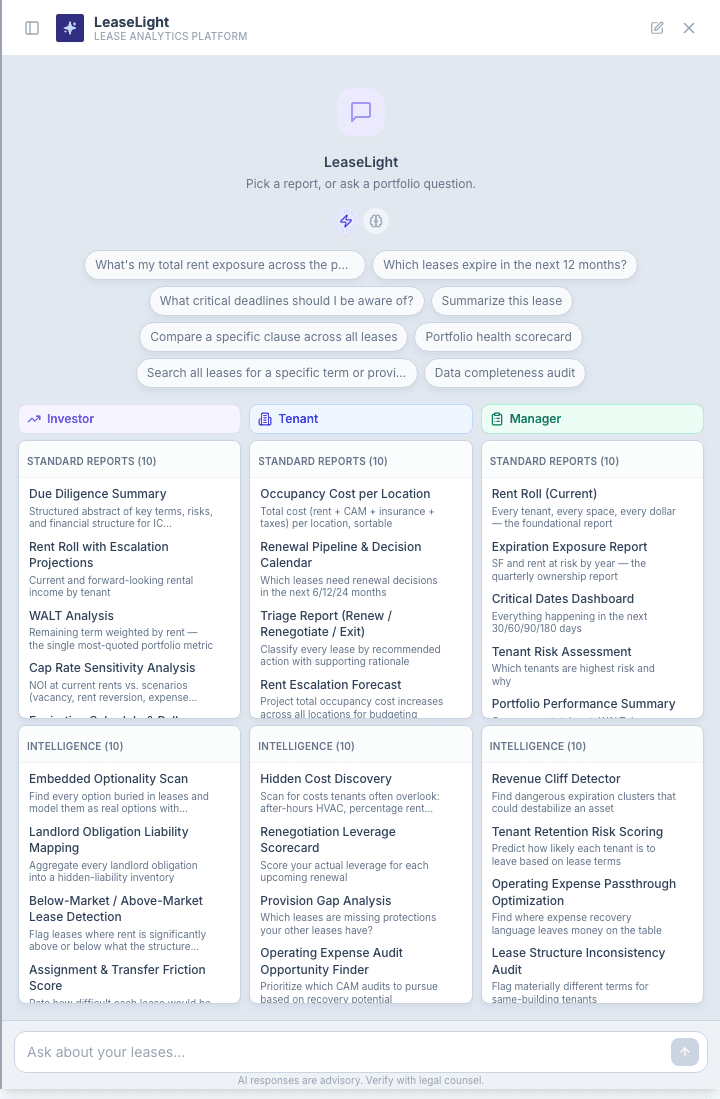
Walkthrough
Two tenants carry most of the portfolio
- 1Start in the report library. Revenue Cliff Detector is one of the diagnostics used to find rent concentration before IC or lender review.
- 2Revenue Cliff Detector scans the next five years of expirations in rolling 6-month periods and flags concentrations above 15% of rent.
- 3Two periods clear the line: 27.7% in late 2026 and 68.1% across December 2029 and January 2030. The second spike is large enough to become an IC and lender issue.
- 4Suggested follow-ups stay tied to the report context. Choose the 2029 follow-up — the drill-down names Verbex Learning as the anchor tenant, the January 2029 notice deadline, and the early-termination right.
- 5Plain English questions help when the room needs precision. A cliff is not an assumed loss of rent; it is contractual exposure that needs underwriting before the deadline.
- 6The final answer turns the chart into memo language: 79.9% of rent is tied to two tenants, the larger tenant is already in holdover (rent-bearing but unresolved), and the relevant notice deadline is tied back to the lease file. The 68.1% cliff is the largest expiration window; the broader concentration finding is 79.9% of rent across the two exposed tenants.
Outputs are advisory and source-cited. Verify before legal action.
The NOI line starts with what you can support.
1The first answer sets the supported line, not the finish line. USD NOI is $1,433,843.38 after the 6% vacancy and credit haircut, with CAD separated and expired tenants excluded. That gives the deal team a cited line before the IC memo or lender package gets circulated.
2The waterfall shows the bridge from rent roll GPR to supported NOI: $1,524,490.92 of USD GPR, less vacancy and credit loss, plus only $874.38 of extracted recoveries. The haircut and recovery limits stay visible instead of buried in a workbook.
3The recovery table is where support thins. Verbex Learning, Inc. carries $1,022,271.72 of USD GPR and NNN classification, but no extracted recovery dollars. For lender review, that is a lease-file question, not a summary-table footnote.
4The finding is the actual pressure point: 66% of active NNN tenants show $0 recoveries, including Verbex Learning, Inc. and Ridgeway Logistics Inc. The $1.6M–$3.3M range is a sensitivity tied to unresolved recovery support, not value included in NOI.
5The recommendation prioritizes the leases most likely to move the underwriting discussion. Start the recovery review with the largest NNN tenants showing $0 recoveries, then verify expired and holdover exposure before the IC memo or lender package gets circulated. The output is a cited NOI line today, with a narrow diligence path for recovery support.
NOI Waterfall
Build an annualized NOI waterfall for the portfolio as of 2026-04-12. Inclusion: Only leases with status = Active. Group by currency. Do not convert currencies. Waterfall line items (in this order): 1. Gross Potential Rent — annualized base rent currently in effect 2. Scheduled Escalations — incremental annualized delta for escalations occurring within the current calendar year only 3. Extracted Expense Recoveries — CAM, taxes, insurance, utilities (explicit extracted dollar amounts only; do not estimate) 4. Gross Potential Income (sum of 1+2+3) 5. Vacancy Loss — 5% of GPI 6. Credit Loss — 1% of GPI 7. Estimated NOI (line 4 minus lines 5 and 6) Show each component as a separate line item with amount and notes. Include a supporting table: each included lease with tenant name, address, and annual rent contribution to GPR. If escalation or recovery data is available for fewer than 50% of included leases, state the coverage gap explicitly and note that actual figures may be materially higher. List excluded leases with status reason. Validate: included count + excluded count = total portfolio count. CHART DIRECTIVES: - REQUIRED: waterfall — NOI waterfall: GPR → +Escalations → +Recoveries → -Vacancy → -Credit Loss → = NOI. Green for additions, red for subtractions, blue for totals.
Annualized NOI Waterfall Report (as of 2026-04-12)
Based on 6 of 12 leases (6 excluded due to 'Expired' status).
Key Takeaways
- Total Estimated NOI: $1,433,843.38 (USD) and $46,617.98 (CAD).
- GPR Contribution: Verbex Learning, Inc. is the largest contributor to USD GPR ($1,022,271.72/year).
- Data Coverage Gap: Escalation and recovery data were available for fewer than 50% of active leases. Actual NOI figures may be materially higher.
- Portfolio Status: 50% of the portfolio (6 leases) is currently classified as 'Expired' and excluded from this NOI analysis.
Portfolio NOI Waterfall
The following waterfall analysis breaks down the transition from Gross Potential Rent to Estimated Net Operating Income, grouped by currency.
USD Portfolio Waterfall
| Line Item | Amount (USD) | Notes |
|---|---|---|
| 1. Gross Potential Rent (GPR) | $1,524,490.92 | Annualized base rent currently in effect for 5 active leases. |
| 2. Scheduled Escalations | $0.00 | No incremental annualized deltas identified for the 2026 calendar year. |
| 3. Extracted Expense Recoveries | $874.38 | Sum of extracted CAM ($437.19) and Utilities ($437.19). |
| 4. Gross Potential Income (GPI) | $1,525,365.30 | Sum of GPR, Escalations, and Recoveries. |
| 5. Vacancy Loss (5%) | ($76,268.27) | 5% of Gross Potential Income. |
| 6. Credit Loss (1%) | ($15,253.65) | 1% of Gross Potential Income. |
| 7. Estimated NOI | $1,433,843.38 | GPI less Vacancy and Credit Loss. |
CAD Portfolio Waterfall
| Line Item | Amount (CAD) | Notes |
|---|---|---|
| 1. Gross Potential Rent (GPR) | $49,593.60 | Annualized base rent for Kettlewater Foods Inc. |
| 2. Scheduled Escalations | $0.00 | No incremental annualized deltas identified for the 2026 calendar year. |
| 3. Extracted Expense Recoveries | $0.00 | No explicit recovery dollar amounts extracted for CAD leases. |
| 4. Gross Potential Income (GPI) | $49,593.60 | Sum of GPR, Escalations, and Recoveries. |
| 5. Vacancy Loss (5%) | ($2,479.68) | 5% of Gross Potential Income. |
| 6. Credit Loss (1%) | ($495.94) | 1% of Gross Potential Income. |
| 7. Estimated NOI | $46,617.98 | GPI less Vacancy and Credit Loss. |
Supporting Lease Data (GPR Contribution)
The table below lists the active leases contributing to the Gross Potential Rent (GPR) used in the waterfall analysis.
Excluded Leases
The following 6 leases were excluded from the NOI analysis as their status is 'Expired'.
| Tenant | Status | Reason |
|---|---|---|
| ACRETIS THERAPEUTICS, INC. | Expired | Status filter: Active only |
| EASTON APPAREL GROUP, INC. | Expired | Status filter: Active only |
| Caldwell & Park, LLC | Expired | Status filter: Active only |
| Beacon Premium Finance Mgmt., LLC | Expired | Status filter: Active only |
| Marigold Fashion Co. | Expired | Status filter: Active only |
| Helion Genomics, Inc. | Expired | Status filter: Active only |
Validation: 6 Included + 6 Excluded = 12 Total Portfolio Leases.
Caveats & Methodology
- GPR: Based on the annualized base rent in effect as of 2026-04-12.
- Escalations: Only includes incremental annualized deltas for rent steps occurring between 2026-01-01 and 2026-12-31.
- Recoveries: Includes only explicit dollar amounts extracted for CAM, Taxes, Insurance, and Utilities. Estimated or percentage-based recoveries are excluded per instructions.
- Coverage Gap: Recovery data was available for only 33.3% of active leases, and no 2026 escalations were identified in the timeline. Actual figures may be materially higher than these extracted minimums.
Show me the specific recovery amounts for Verbex Learning, Inc.
For the VERBEX LEARNING, INC. VERBEX LEARNING, INC. lease, specific dollar amounts for recoveries were not extracted.
The lease is classified as Triple Net (NNN) Rent Structure, meaning the tenant is responsible for their pro-rata share of operating expenses, taxes, and insurance. However, the document does not specify fixed or estimated dollar amounts for these charges that could be included in the "Extracted Expense Recoveries" line of the NOI waterfall.
Recovery Data Summary
| Component | Amount | Status |
|---|---|---|
| Rent Structure | Triple Net | Extracted Rent Structure |
| CAM / Operating Expenses | — | Not found in document |
| Real Estate Taxes | — | Not found in document |
| Insurance | — | Extraction failed |
| Utilities | — | Not found in document |
Because this is a Triple Net lease, the actual NOI would likely be higher if these pass-through expenses were quantified, as they would offset the landlord's operating costs.
What's the difference between gross potential rent and NOI? Why is the gap so big?
Portfolio NOI Waterfall Analysis
Effective Date: 2026-04-12
Coverage: Based on 6 of 12 leases (6 excluded due to 'Expired' status).
Key Takeaways
- Total Estimated NOI: $1,433,843.38 (USD) and $46,617.98 (CAD).
- Data Coverage Gap: Escalation and recovery data is available for less than 20% of active leases. Actual NOI may be materially higher if Triple Net (NNN) recoveries were fully quantified.
- Portfolio Stability: The portfolio is currently 50% active by lease count, with the remaining 50% in 'Expired' status.
Conceptual Overview: GPR vs. NOI
Gross Potential Rent (GPR) is your "top-line" potential—the total base rent you would collect if every active lease paid their current rate.
Net Operating Income (NOI) is your "bottom-line" operating profit. The "gap" between them is created by:
- Additions: Scheduled rent escalations and expense recoveries (tenants paying their share of taxes/CAM).
- Subtractions: Vacancy loss (unoccupied space) and credit loss (uncollected rent).
Why the gap is so big here: In this model, the gap is primarily driven by the 6% combined haircut for vacancy and credit loss, and a lack of extracted recovery data. For example, VERBEX LEARNING, INC. is a Triple Net lease, but because specific recovery dollar amounts weren't extracted, the model shows the landlord bearing those costs without the offsetting income, which artificially suppresses the estimated NOI.
Annualized NOI Waterfall (USD)
| Component | Amount (USD) | Notes |
|---|---|---|
| 1. Gross Potential Rent | $1,524,490.92 | Annualized base rent currently in effect. |
| 2. Scheduled Escalations | $0.00 | No rent escalations found in the 2026 calendar year. |
| 3. Extracted Recoveries | $874.38 | Explicitly extracted CAM and Utility charges. |
| 4. Gross Potential Income | $1,525,365.30 | Sum of GPR, Escalations, and Recoveries. |
| 5. Vacancy Loss | ($76,268.27) | 5% of Gross Potential Income. |
| 6. Credit Loss | ($15,253.65) | 1% of Gross Potential Income. |
| 7. Estimated NOI | $1,433,843.38 | GPI minus Vacancy and Credit Loss. |
Annualized NOI Waterfall (CAD)
| Component | Amount (CAD) | Notes |
|---|---|---|
| 1. Gross Potential Rent | $49,593.60 | Annualized base rent currently in effect. |
| 2. Scheduled Escalations | $0.00 | No rent escalations found in the 2026 calendar year. |
| 3. Extracted Recoveries | $0.00 | No explicit recovery amounts extracted. |
| 4. Gross Potential Income | $49,593.60 | Sum of GPR, Escalations, and Recoveries. |
| 5. Vacancy Loss | ($2,479.68) | 5% of Gross Potential Income. |
| 6. Credit Loss | ($495.94) | 1% of Gross Potential Income. |
| 7. Estimated NOI | $46,617.98 | GPI minus Vacancy and Credit Loss. |
Supporting Rent Roll (Active Leases)
The following leases contribute to the Gross Potential Rent (GPR) figures above.
Excluded Leases
The following 6 leases were excluded from the NOI waterfall as they are no longer active.
| Tenant | Status | Link |
|---|---|---|
| ACRETIS THERAPEUTICS, INC. | Expired | View Lease |
| EASTON APPAREL GROUP, INC. | Expired | View Lease |
| Caldwell & Park, LLC | Expired | View Lease |
| Beacon Premium Finance Mgmt., LLC | Expired | View Lease |
| Marigold Fashion Co. | Expired | View Lease |
| Helion Genomics, Inc. | Expired | View Lease |
Validation: 6 Included + 6 Excluded = 12 Total Portfolio Leases.
Caveats & Methodology:
- Escalations: Calculated as the annualized delta for rent increases occurring between 2026-01-01 and 2026-12-31.
- Recoveries: Includes only explicit dollar amounts for CAM, Insurance, Taxes, and Utilities. Many leases in the portfolio (e.g., Verbex Learning) are NNN but do not specify fixed recovery amounts in the document, leading to an underestimation of total recoveries.
- Loss Factors: Vacancy (5%) and Credit Loss (1%) are applied as standard portfolio-wide assumptions.
What's the single most important finding here and why should I care?
The single most important finding is the "Hidden NOI" opportunity caused by a massive gap in expense recovery data.
The Finding:
While your estimated NOI is $1.43M, this figure is likely a significant underestimate because 66% of your active NNN (Triple Net) tenants are currently showing $0 in recoveries.
Why You Should Care:
In a Triple Net lease, the tenant is responsible for their share of taxes, insurance, and CAM. However, for major tenants like VERBEX LEARNING, INC. and RIDGEWAY LOGISTICS INC., the model shows $0 in recovery income.
This matters for two reasons:
- Valuation Understatement: If these tenants are meant to reimburse $5–$10/SF in expenses that aren't being captured here, your "true" NOI could be $100k–$200k higher. At a 6% cap rate, that's a $1.6M–$3.3M swing in property value that is currently invisible.
- Operational Leakage: If your accounting team isn't actually billing these recoveries (or if the data is simply missing from the system), the landlord is effectively paying the tenants' bills, directly eroding your profit margin.
The Secondary Risk: 50% Expiration
Beyond the data gap, 50% of your total portfolio (6 of 12 leases) is currently expired. This represents a critical "fork in the road":
- The Risk: If these tenants have vacated without being updated in the system, your actual income will drop sharply.
- The Opportunity: If they are still in possession as holdovers, you likely have the right to charge 125%–150% of base rent (standard holdover rates), or the opportunity to reset these leases to current market rates.
Recommendation: Prioritize a "Recovery Audit" for Verbex Learning and Ridgeway Logistics to quantify their NNN obligations and verify the status of the 6 expired leases to secure your cash flow.
Recovery upside is a renewal sensitivity, not current NOI.
Recovery upside is framed as a cited renewal sensitivity, not current NOI.
1Recovery mechanics firstThe ask starts with classification, caps, base years, and fees. Review starts with recovery mechanics, not headline rent.
2NNN and Gross splitThe chart shows 72% NNN and 28% Gross. The mix isolates where recovery treatment needs lease-level support.
3NNN still needs supportBase years, caps, exclusions, and missing fees narrow recovery. Type alone is not enough for lender review or IC support.
4Portfolio drag separates from lease actionsThe table separates portfolio-level recovery drag from tenant-level renewal or conversion targets. It shows which leases are concentrated risk for the model.
5Scenario stays boundedVesper Biolabs shows $126K per year of modeled recovery upside; Verbex shows $32K. The roughly $2.0M value impact is shown only as a capitalized renewal sensitivity. It is more defensible when tied back to lease text and kept separate from in-place NOI.
Recovery Ratio Analysis
Analyze expense recovery provisions across all leases to determine what percentage of operating expenses is recoverable. For each lease: - Tenant | Lease Type | Expense Structure | Recoverable Categories | Excluded Categories | Base Year (if applicable) | Cap (if applicable) | Admin/Management Fee % Recovery classification per lease: - Full Recovery: NNN with minimal exclusions - Partial Recovery: Modified Gross or NNN with significant exclusions/caps - No Recovery: Gross/Full Service — landlord absorbs all - Unclear: Insufficient data to classify Present a portfolio summary: - Percentage of rent in Full / Partial / No Recovery categories - Specific provisions that limit recovery (with citations): - CapEx exclusions - Base year provisions creating lag - Expense caps limiting passthrough - Missing admin/management fee provisions Identify the top 3 leases where recovery language improvement would have the greatest financial impact (by rent size × recovery gap). CHART DIRECTIVES: - REQUIRED: donut — Recovery classification: % of annual rent in Full Recovery / Partial Recovery / No Recovery / Unclear - OPTIONAL (≥5 leases with expense data): bar — Recovery gaps: horizontal bar per lease showing estimated unrecoverable expense exposure
Based on an analysis of 6 active or expiring leases (6 expired leases excluded), the portfolio's expense recovery profile is bifurcated between Full Recovery (NNN) and No Recovery (Gross) structures. Approximately 72% of total annualized rent is protected by NNN structures, while 28% remains exposed to operating expense fluctuations under Gross lease terms.
Key Takeaways
- High Concentration in NNN: The majority of portfolio revenue ($1.13M) is derived from NNN leases, primarily driven by the Verbex Learning, Inc. lease.
- Significant Gross Exposure: Three leases (28% of rent) are structured as Gross, where the landlord absorbs all utilities and property taxes, creating a direct hit to NOI as costs rise.
- CapEx & Base Year Lag: The largest lease (Verbex Learning) utilizes a 2016 Base Year, which may create a recovery lag if current expenses have significantly outpaced the 2016 baseline.
- Improvement Opportunity: Transitioning the Vesper Biolabs, Inc. Gross leases to NNN or Modified Gross could recover an estimated $137k+ in annual operating expenses.
Portfolio Recovery Summary
The following chart illustrates the distribution of annualized rent across recovery classifications.
| Recovery Classification | Lease Count | Total Annual Rent | % of Portfolio Rent |
|---|---|---|---|
| Full Recovery | 3 | $1,132,666.92 | 72.0% |
| No Recovery | 3 | $441,417.60 | 28.0% |
| Partial Recovery | 0 | — | 0.0% |
| Unclear | 0 | — | 0.0% |
Specific Provisions Limiting Recovery
While NNN leases generally provide full passthrough, specific language in the portfolio creates recovery leakage:
- CapEx Exclusions & Amortization Caps:
- Verbex Learning, Inc.: Capital improvements intended to reduce expenses are amortized over their useful life, but annual recovery is strictly capped at the actual savings achieved by the improvement in that year Page 15, blk_205.
- Base Year Lag:
- Verbex Learning, Inc.: Recovery is based on a 2016 Base Year Page 14, blk_199. If current operating expenses are significantly higher than 2016 levels, the landlord is absorbing the baseline cost.
- Landlord-Paid Utilities (Gross Leases):
- Vesper Biolabs, Inc.: The landlord pays for all gas, electric, water, and sewer, which are included in the Gross Rent. There is no provision for overage passthroughs.
- Missing Admin/Management Fee Caps:
- Most leases in the portfolio (including Ridgeway Logistics and Marcela Quintero-Vargas) do not specify a cap on management fees, which is favorable for the landlord, though Helion Genomics (expired) explicitly included administrative and management fees in its project management overhead Page 47, blk_834.
Recovery Improvement Opportunities
The following leases represent the greatest financial impact if recovery language were improved (calculated by rent size × estimated recovery gap).
- VESPER BIOLABS, INC. ($360,000/year): Currently Gross. Landlord absorbs all utilities (gas, electric, water, sewer).
- Kettlewater Foods Inc. ($49,593.60/year): Currently Gross. No expense passthrough provisions identified.
- Vesper Biolabs, Inc. ($31,824/year): Currently Gross. Landlord responsible for all Property Tax, Building Insurance, and Utilities.
Expense Recovery Provisions by Lease
The table below details the specific recovery structures and categories for all active leases.
Excluded Leases
The following leases were excluded from this analysis because their status is Expired:
- ACRETIS THERAPEUTICS, INC.
- EASTON APPAREL GROUP, INC.
- Caldwell & Park, LLC
- Beacon Premium Finance Mgmt., LLC
- Marigold Fashion Co.
- Helion Genomics
Caveats & Methodology:
- Recovery Classification: Derived from the
rent_structurefield. "Full Recovery" corresponds to NNN/Absolute Net; "No Recovery" corresponds to Gross/Percentage. - Recovery Gap Proxy: Estimated as 35% of annual rent for Gross leases and 15% for Modified Gross/Partial leases to represent unrecovered expense exposure.
- Currency: Portfolio totals include mixed currencies (USD and CAD). CAD values were summed without conversion.
What is the total estimated dollar value of the recovery gap for the Gross leases?
The total estimated dollar value of the recovery gap for the Gross leases in the portfolio is $137,138.40 (USD) and 17,357.76 CAD.
This estimate is based on the "No Recovery" proxy (35% of annual rent), representing the operating expenses currently absorbed by the landlord that would typically be recoverable under a NNN structure.
Breakdown by Tenant
| Tenant | Currency | Annual Rent | Estimated Recovery Gap (35%) |
|---|---|---|---|
| VESPER BIOLABS, INC. | USD | $360,000.00 | $126,000.00 |
| Vesper Biolabs, Inc. | USD | $31,824.00 | $11,138.40 |
| Kettlewater Foods Inc. | CAD | 49,593.60 CAD | 17,357.76 CAD |
| Total (USD) | USD | $391,824.00 | $137,138.40 |
| Total (CAD) | CAD | 49,593.60 CAD | 17,357.76 CAD |
Note: These figures represent estimated exposure based on the 35% recovery gap assumption for Gross leases. Actual unrecovered expenses may vary based on specific property operating costs.
What does 'full recovery' vs 'no recovery' mean? Am I losing money on the no recovery ones?
In commercial real estate, these terms describe how operating expenses (taxes, insurance, and maintenance) are split between you and the tenant.
1. Full Recovery (NNN / Triple Net)
- What it means: The tenant pays a base rent plus their pro-rata share of all operating expenses.
- Your Position: You are protected. If property taxes or utility costs double, the tenant pays the increase. Your "Net" income remains stable regardless of how expensive it is to run the building.
- Portfolio Status: 72% of your portfolio rent follows this structure.
2. No Recovery (Gross / Full Service)
- What it means: The tenant pays one flat "Gross" rent. You, as the landlord, are responsible for paying all taxes, insurance, and maintenance out of that single check.
- Your Position: You are exposed to inflation. If operating expenses rise, your profit margin shrinks because you cannot pass those costs through to the tenant.
- Portfolio Status: 28% of your portfolio rent (primarily VESPER BIOLABS, INC. and Kettlewater Foods Inc.) is in this category.
Are you "losing money" on the No Recovery leases?
Technically, you are "losing" the opportunity to recover expenses that are standard in the market. Whether you are losing money in absolute terms depends on your original underwriting, but here is the current impact:
- Margin Erosion: For Kettlewater Foods Inc. Kettlewater Foods Inc., the lease is flagged as Elevated Risk Analysis specifically because you absorb all costs. Every dollar spent on HVAC repairs or property tax increases at this location comes directly out of your pocket.
- The "Recovery Gap": Based on a standard 35% expense ratio, you are currently absorbing approximately $137,138.40 USD and 17,357.76 CAD in annual expenses for these Gross leases. In a "Full Recovery" scenario, this amount would be additional revenue paid by the tenants.
- Inflation Risk: Because VESPER BIOLABS, INC. VESPER BIOLABS, INC. pays a flat $30,000/month Initial Base Rent, any spike in Salt Lake City property taxes or utility rates this year will directly reduce your net operating income (NOI) for that asset.
Summary: You aren't necessarily "writing a check" to keep the building open, but you are carrying the full financial burden of the building's operations, which makes these leases significantly less profitable and more volatile than your NNN leases.
What's the single most important finding here and why should I care?
The single most important finding is that your portfolio is currently "leaking" approximately $137,138 USD and 17,357 CAD every year due to inefficient expense recovery structures.
Why you should care: The $2.28 Million Valuation Hit
In commercial real estate, property value is a multiple of your Net Operating Income (NOI). Every dollar of expense you absorb instead of recovering from a tenant is a dollar of lost NOI.
If you were to sell these assets today at a 6% cap rate, that $137,138 in unrecovered expenses would reduce your total property valuation by approximately $2,285,640. By simply converting these leases to a standard NNN (Full Recovery) structure at renewal, you could potentially "unlock" over $2M in asset value without increasing the base rent by a single cent.
The Two Primary Drivers of This Risk:
-
The "Gross" Leakage (Vesper Biolabs): VESPER BIOLABS, INC. VESPER BIOLABS, INC. is the largest contributor, representing $126,000/year of that gap. Because they pay a flat $30,000/month Initial Base Rent, you are 100% exposed to any spikes in property taxes or utility costs for their 30,000+ SF facility.
-
The "Stealth" Inflation Lag (Verbex Learning): While VERBEX LEARNING, INC. VERBEX LEARNING, INC. is technically a recovery-based lease, it uses a 2016 Base Year Base Year.
- The Problem: It is now 2026. You are paying for 10 years of inflation on property taxes, insurance, and labor before Verbex Learning is required to pay their first dollar of "increases."
- The Impact: For a 15,989 RSF space Square Footage (RSF), even a modest $2.00/SF increase in operating costs since 2016 means you are absorbing ~$32,000/year in costs that a modern lease (with a 2025 or 2026 Base Year) would have passed through to the tenant.
Key Takeaway: Your portfolio's "Full Recovery" headline (72%) masks a significant concentration of inflation risk in your largest tenants. Prioritizing "Base Year Resets" or "NNN Conversions" during the next round of renewals for these three tenants should be your top strategic priority to protect your asset value.
Provision gaps are a diligence map, not a loss claim.
Provision gaps are mapped as diligence exposure, not predicted loss.
1Provisions become a mapThe ask requests a matrix, gap score, rent exposure, and benchmark language. Review turns scattered provisions into a portfolio control map.
2The pattern repeatsThe heatmap shows missing rights clustered across leases. The pattern is portfolio-level, not limited to one lease.
3Rights are missingOpEx caps and CAM review rights are missing across the set. In this reviewed set, 66% lack explicit SNDA protection. These are rights buyers and lenders ask about.
4Reference language surfacesThe report pulls best-in-portfolio language forward. It becomes a checklist for renewal and amendment work.
5Rent exposure is scopedMore than $1.4M of annual rent sits in leases missing explicit OpEx cap language, CAM review rights, or both. $440K of annual rent is tied to leases without explicit SNDA protection. This is a diligence map before IC memo or lender package gets circulated.
Provision Gap Analysis
Compare provisions across all leases and identify gaps where some leases lack protections that other leases in the portfolio include. Provisions to compare: 1. Force majeure clause 2. Assignment/sublease rights 3. Early termination option 4. Operating expense cap 5. CAM audit rights 6. Co-tenancy protections 7. Exclusivity protections 8. SNDA requirement 9. Renewal option 10. Expansion option 11. Right of first refusal / offer 12. Relocation right protections 13. Non-disturbance agreement 14. Holdover rate specification Present a matrix: Rows = Leases (sorted by annual rent descending) Columns = Provisions 1-14 Cells = ✓ (present) | ✗ (not found) | — (not extracted) Summary metrics: - "Gap score" per lease: count of ✗ provisions - Most commonly missing provision across the portfolio - Leases with the most gaps (highest gap score) - Revenue at risk: total rent associated with leases missing each provision For the top 3 most impactful gaps (by revenue at risk), cite the best-in-portfolio exemplar as benchmark language and suggest specific improvements based on that exemplar. CHART DIRECTIVES: - REQUIRED: heatmap — Provision matrix: rows = leases (sorted by annual rent descending), columns = 14 provisions. Cells: green (present), red (missing), gray (not extracted). Use source_op=presence_matrix with check_columns.
This report identifies critical provision gaps across the portfolio's active leases, quantifying the financial exposure ("Revenue at Risk") where standard tenant protections are absent.
Based on 6 of 12 analyzed leases (6 excluded as Expired).
Key Takeaways
- Systemic Gaps: 100% of the active portfolio lacks Operating Expense Caps and CAM Audit Rights, exposing over $1.4M in annual rent to uncontrolled expense pass-throughs.
- SNDA Exposure: 66% of active leases (by count) lack Non-Disturbance Agreements (SNDA), creating significant risk of lease termination in the event of landlord foreclosure.
- Relocation Risk: Only VERBEX LEARNING, INC. has explicit relocation protections; all other tenants are vulnerable to landlord-mandated moves without supported cost reimbursement.
- Revenue at Risk: The highest financial exposure is concentrated in the VERBEX LEARNING, INC. and VESPER BIOLABS, INC. leases, which represent ~90% of the active portfolio's annualized revenue.
Provision Gap Matrix (Active Leases)
The following matrix tracks the presence of 14 key provisions across the active portfolio. Leases are sorted by annual rent (descending).
| Tenant | Annual Rent | FM | ASGN | ET | CAP | AUDIT | COTEN | EXCL | SNDA | REN | EXP | ROFR | RELOC | NDA | HOLD |
|---|---|---|---|---|---|---|---|---|---|---|---|---|---|---|---|
| VERBEX LEARNING, INC. | $925,903/yr | ✗ | ✓ | ✓ | ✗ | ✗ | ✗ | ✗ | ✓ | ✗ | ✗ | ✗ | ✓ | ✓ | ✓ |
| VESPER BIOLABS, INC. | $360,000/yr | ✗ | ✓ | ✓ | ✗ | ✗ | ✗ | ✗ | ✗ | ✓ | ✗ | ✗ | ✗ | ✗ | ✓ |
| RIDGEWAY LOGISTICS INC. | $66,000/yr | ✗ | ✓ | ✓ | ✗ | ✗ | ✗ | ✗ | ✓ | ✗ | ✗ | ✗ | ✗ | ✓ | ✓ |
| Kettlewater Foods Inc. | $49,594/yr* | ✗ | ✓ | ✓ | ✗ | ✗ | ✗ | ✗ | ✗ | ✓ | ✗ | ✗ | ✗ | ✗ | ✓ |
| Marcela Quintero-Vargas | $44,395/yr | ✗ | ✓ | ✓ | ✗ | ✗ | ✗ | ✗ | ✓ | ✗ | ✗ | ✗ | ✗ | ✗ | ✓ |
| Vesper Biolabs, Inc. | $30,000/yr | ✗ | ✓ | ✓ | ✗ | ✗ | ✗ | ✗ | ✗ | ✓ | ✗ | ✗ | ✗ | ✗ | ✓ |
Legend: ✓ Present | ✗ Not found in document | — Not extracted | *Converted from CAD
Summary Metrics & Risk Analysis
Most Commonly Missing Provisions
- Operating Expense Cap / CAM Audit Rights: Missing in 100% of active leases.
- Force Majeure: Missing in 100% of active leases.
- Expansion / ROFR / ROFO: Missing in 100% of active leases.
- Relocation Protections: Missing in 83% of active leases.
Revenue at Risk (Annualized)
| Provision Gap | Leases Missing | Total Revenue at Risk |
|---|---|---|
| OpEx Cap / Audit Rights | 6 | $1,475,892 |
| Force Majeure | 6 | $1,475,892 |
| SNDA / NDA | 3 | $439,594 |
| Relocation Protections | 5 | $549,989 |
Top 3 Impactful Gaps & Benchmark Exemplars
1. SNDA / Non-Disturbance Protections
- Risk: Without an SNDA, a lender can terminate the lease upon foreclosure, regardless of the tenant's compliance.
- Benchmark Exemplar: VERBEX LEARNING, INC. Page 7, blk_101
- Language: "Landlord shall deliver to Tenant a consent, subordination, non-disturbance and attornment... in form and substance reasonably satisfactory to Tenant." View Source
- Suggested Improvement: Require the landlord to provide a commercially reasonable SNDA from any current or future mortgagee as a condition of subordination.
2. Relocation Right Protections
- Risk: Landlords can move tenants to inferior space, disrupting operations and incurring significant costs.
- Benchmark Exemplar: Helion Genomics Page 38, blk_704
- Language: "Landlord reserves the right... to substitute other space... provided the Rentable Area... is approximately the same... and all other out-of-pocket costs directly incurred by Tenant [are reimbursed]." View Source
- Suggested Improvement: Limit relocation to space of equal or better quality/visibility and mandate full reimbursement for all moving, IT, and stationery costs.
3. Renewal Options
- Risk: Tenants lack long-term security and may be forced to vacate or renegotiate at unfavorable rates.
- Benchmark Exemplar: Kettlewater Foods Inc. Number of Renewal Options
- Language: Provides for explicit renewal terms with defined notice windows. View Source
- Suggested Improvement: Standardize a 5-year renewal option at 95% of Fair Market Value (FMV) with a 6-9 month notice period.
Excluded Leases
The following 6 leases were excluded from this analysis as their status is Expired:
- ACRETIS THERAPEUTICS, INC. View
- EASTON APPAREL GROUP, INC. View
- Caldwell & Park, LLC View
- Beacon Premium Finance Mgmt., LLC View
- Marigold Fashion Co. View
- Helion Genomics View
Caveats & Methodology: Revenue at risk is calculated using the initial base rent annualized for active leases. "Not found in document" indicates the provision was not identified during extraction; verification via full-text search is recommended for critical decisions.
Calculate the total potential savings if a 5% OpEx cap were applied to the Verbex Learning lease.
A specific dollar amount for Operating Expenses (OpEx) is not stated in the VERBEX LEARNING, INC. lease or its six amendments. This is standard for commercial leases using a Base Year structure, where the actual dollar amount is provided by the landlord in annual reconciliation statements rather than being fixed in the lease text.
However, based on the lease terms, here is the methodology and the variables required to calculate the potential savings from a 5% OpEx cap:
1. Lease Variables
- Rent Structure: Base Year (Tenant pays increases over the Base Year) Rent Structure
- Base Year: 2016 Base Year
- Current Square Footage: 37,328 RSF (as of the Sixth Amendment) Page 4, blk_29
- Tenant's Proportionate Share: 78.66% (as of the Fifth Amendment) Page 5, blk_73
2. Calculation Methodology
In a Base Year lease, a 5% cap typically limits the year-over-year increase in "controllable" operating expenses.
Formula for Potential Savings: $$\text{Potential Savings} = (\text{Actual OpEx Increase} - \text{Capped OpEx Increase}) \times \text{Proportionate Share}$$
- Scenario: If the total Building OpEx increased by 10% ($100,000) over the prior year, but a 5% cap were in place:
- Uncapped Increase: $100,000
- Capped Increase (5%): $50,000
- Building-wide Savings: $50,000
- Verbex Learning Potential Savings: $50,000 \times 78.66% = \mathbf{$39,330}$
3. Key Findings on Expense Protections
- Current Status: The lease currently has no cap on Operating Expenses or Taxes Page 18, blk_218.
- Capital Expenditures: The lease does include a protection for "Included Capital Expenditures," stating that the annual cost amortized to the tenant cannot exceed the actual savings achieved by that expenditure in that year Page 15, blk_205.
To calculate an exact dollar figure, you would need the 2025 Operating Expense Statement from the landlord to establish the current baseline.
If a provision is missing from my lease, does that mean I have no protection at all?
In commercial real estate, the absence of a provision does not necessarily mean you have "no protection," but it significantly shifts the burden of proof and often defaults to state law or landlord-favorable standards.
Here is how "missing" provisions are typically handled:
1. The "Entire Agreement" (Merger) Clause
Most commercial leases, including the VERBEX LEARNING, INC. lease, contain an "Entire Agreement" clause. This provision states that the written lease contains the entire agreement between the parties and supersedes all prior oral or written understandings Page 46, blk_418.
- The Risk: If a protection (like an OpEx cap) was discussed during negotiations but not written into the final signed document, it generally cannot be enforced.
2. Default to State Law
If a lease is silent on a specific issue, the "default" is often governed by the laws of the state where the property is located. For the Verbex Learning lease, this is the Commonwealth of Pennsylvania Page 43, blk_399.
- Statutory Protections: Some states have laws that protect tenants even if the lease is silent (e.g., requirements for how security deposits are held or limits on self-help evictions).
- Common Law: Principles like the "Covenant of Quiet Enjoyment" are often implied in a lease even if not explicitly stated, meaning the landlord cannot substantially interfere with your use of the space.
3. "Four Corners" Doctrine
Commercial leases are generally interpreted within the "four corners" of the document.
- Missing Tenant Rights: If the lease doesn't grant you a specific right (like a Right of First Refusal or an Early Termination Option), you generally do not have that right. You would have to negotiate with the landlord for a new amendment to obtain it.
- Missing Landlord Obligations: If the lease doesn't explicitly say the landlord must provide a certain service (like 24/7 security), they are generally not contractually obligated to do so, even if they currently provide it.
4. Gap Analysis Summary
The "Gap Analysis" provided earlier identifies areas where your lease is silent compared to market-standard "best-in-class" protections.
- Example: The absence of a CAM Audit Right means you have no contractual mechanism to verify the landlord's expense billings. While you might still have a common-law right to challenge a fraudulent bill, it is much harder and more expensive to enforce than a simple contractual audit clause.
Conclusion: While you may have some baseline protections under state law, commercial real estate is largely "buyer beware." The most robust protections are those explicitly negotiated and written into the lease.
Disclaimer: I am an AI analytics engine, not an attorney. This information is for analytical purposes and does not constitute legal advice. You should consult with legal counsel regarding the specific application of law to your lease.
What's the single most important finding here and why should I care?
The single most important finding is that 100% of your active leases lack both Operating Expense (OpEx) caps and CAM audit rights.
Why you should care:
In commercial real estate, this combination creates a "Blank Check" risk that directly impacts your bottom line and portfolio valuation.
- Uncapped Financial Exposure: Without an OpEx cap, you have no protection against sudden spikes in building costs. If the landlord’s insurance premiums double or utility rates soar, those costs are passed directly to you with no limit. In the current inflationary environment, this is a major budget volatility risk.
- Zero Transparency: Without audit rights, you are contractually required to pay whatever the landlord bills you for "Common Area Maintenance" (CAM) without any mechanism to verify the math. You cannot confirm if you are being overcharged, if the landlord is including capital expenses that should be excluded, or if you are paying for expenses that belong to other tenants.
- Structural Portfolio Weakness: This isn't a one-off oversight; it is a systemic gap across your entire portfolio. If you were to sell these lease assets or the properties, a sophisticated buyer would "haircut" the value because of the lack of these standard institutional-grade protections.
The "Tail Risk" Warning:
While the OpEx/Audit gap hits your cash flow every month, the missing SNDA (Subordination, Non-Disturbance, and Attornment) protections represent an existential risk to your operations. With $440k in annual rent currently unprotected, a foreclosure by your landlord’s lender could technically allow the bank to terminate your leases and evict you—even if you have never missed a rent payment.
Recommendation: Your next round of renewals or amendments should prioritize "Financial Hygiene" (Audit Rights and OpEx Caps) and "Occupancy Security" (SNDA) to bring these leases up to market standard.
Lease-level decisions
For deal teams, asset owners, and property managers who need lease answers tied to source text, change history, and reviewer decisions.
When a lease value behind a report gets challenged, the trail should not end in a PDF search. The source text, change history, and reviewer decision stay visible.
- Extracted fields
- Obligations, dates, costs, and rights become reviewable lease fields.
- Source citations
- Page and block references point reviewers back to the source clause.
- Field detail
- Each value opens with clause context, notes, and reviewer decisions behind the answer.
- Change history
- Revisions are recorded and reversible, with the history intact.
- Overrides
- Close calls stay under reviewer control; Edit and Revert keep the prior value and new decision visible.


Each example opens the field, source citation, change history, and reviewer decision behind the answer.
A patio amendment changes who owns the roof
1The roof issues that get missed look settled at first glance. The base lease assigns roof responsibility cleanly to Landlord, captured directly from blk_271 page 26 at 100% confidence. On a normal review, that feels done — and the eye moves on.
2Four pages into Amendment #2, a rooftop-patio carveout introduces tenant construction duties and warranty obligations, while landlord's contractors handle roof penetrations. The base abstract is no longer complete. LeaseLight caught the conflict during amendment review and surfaced it as an amendment edit — the original answer preserved, the change history attached.
3Every block reference opens the actual PDF page. blk_78 on page 4 carries the amendment clause; click once and you're reading the exact language behind the change. Every value points back to the page that supports it.
4Shared at 85% — the lower score reflects amendment-based reasoning, not weak extraction. The original Landlord extraction stays visible. The change is reviewable, not buried, when you defend the number to IC, lenders, or owners.
Roof Responsibility
Other Obligations › Maintenance Repair
Current Validated Value
AMENDMENTFull Lineage
Edit
—AmendmentAMENDMENTSECOND AMENDMENT TO OFFICE LEASE AGREEMENT
—AppliedAMD #2Pipeline Value
—DirectDIRECTRaw Data Extractions
—1 itemext_99Walkthrough
Stated term and dates do not match
- The lease says 5 years. The dates say 59 months. A single-value extraction makes that look settled when it is not.
- The resolve check looks beyond the stated phrase: it examines commencement, expiration, rent commencement, abatement, payment count, and renewal language.
- The conflict is caught, sourced, and recorded with the math that supports each reading.
- Clear conflicts resolve with confidence. Close calls — like this one — record a sourced best call with the alternative left visible for review.
Term Length
Term & Possession › Initial Term
Field Analyst Ask for help
Ask Field Analyst for help on Term Length
Resolve the flag. Are there other dates that confirm 5 years or 59 months?
The lease contains a direct contradiction between the stated duration and the specific dates provided:
- Stated Duration: Section 2 explicitly defines the term as “5 years” Page 1, blk_9.
- Calculated Duration: The dates “August 1, 2019” to “July 1, 2024” Page 1, blk_9 span exactly 59 months.
Supporting Evidence for 59 Months
The rent payment schedule further supports the 59-month calculation rather than a full 5-year (60-month) term:
- Rent Start Date: Base rental payments begin on November 1, 2019 Page 2, blk_14.
- Abatement: The lease grants two months of abated rent from execution (July 9, 2019). If the term starts August 1, this accounts for August and September as abated.
- Total Period: From the August 1 commencement to the November 1 rent start is a 3-month gap (likely covering the 2-month abatement plus one additional month). From November 1, 2019, to the July 1, 2024 expiration is exactly 56 monthly payments.
- Total Term: 3 months (abatement/gap) + 56 payments = 59 months.
Despite this mathematical alignment with 59 months, I have maintained the value as 5 years to reflect the primary stated term in the document, while adding a note to resolve the validation flag regarding the date discrepancy.
Current Validated Value
VERIFIED EDITEDFull Lineage
Edit
— Field Analyst Assisted FIELD ANALYST ASSISTEDPipeline Value
— Direct DIRECTUpdate
— 1 corrected, 0 inferredext_114
Raw Data Extractions
— 1 itemext_114100%Landlord default has two cure periods
1Thirty days looks like the answer. That is why this clause gets missed. The lease gives Landlord 30 days after written notice to cure a default: clean number, clean sentence, 100% score from blk_374 on page 40. Under deal pressure, that field can feel finished.
2The same paragraph adds a second clock. If the default cannot reasonably be cured within 30 days, Landlord can have up to 90 days, provided cure starts inside the first 30. Single-pass, single-value abstraction tends to flatten that into one number. LeaseLight preserves the 90-day extension as a second source-backed row.
3Both rows point to blk_374 on page 40. The 30-day rule is the general cure period. The 90-day rule is the extension tied to a specific trigger. The reviewer is not asked to trust a summary; each value stays attached to the language that supports it.
4The final value is a structured two-row table, not a single answer. Row 1 records the 30-day general cure at 100%. Row 2 records the 90-day conditional extension at 95%, because the value depends on the trigger. The risk is visible up front and does not depend on reviewer memory or re-reading.
Cure Period
Defaults & Remedies › Landlord Default
Current Validated Value
VERIFIED| Unit | Value |
|---|---|
| days | 30 |
| days | 90 |
Full Lineage
Final Value
—MergedMERGED| Unit | Value |
|---|---|
| days | 30 |
| days | 90 |
Raw Data Extractions
—2 itemsext_14ext_15Utility payments sit beside CAM language
1Utilities are the trap. They sit close enough to CAM language to look included, while the lease points to a narrower answer: Taxes and Operating Expenses. The lease does not give that answer in one clean CAM-definition paragraph. The answer has to be inferred from indirect evidence: Taxes and Operating Expenses define the CAM bucket, while utility language sits near expense language.
2The inferred answer held up after review. Section 5.1 named the cost categories on page 15 and page 16. The Sixth Amendment was then checked against that read, and it clarified utilities as the tenant’s direct payment obligation, not a CAM component. The confirmation was recorded with the same final categories.
3That amendment matters because it draws the boundary. A single-pass, single-value abstraction can fold nearby utility reimbursement into CAM. Here, the source link shows the opposite: utilities are acknowledged, but separated from the CAM answer.
4The validated value stays narrow: Taxes and Operating Expenses. Utilities are not ignored. They are visible in the record, checked against the amendment, and kept out of the final field because the lease makes them a separate responsibility.
CAM Definition
Rent & Financials › CAM Details
Current Validated Value
EDITED- •Taxes
- •Operating Expenses
Full Lineage
Edit
—Field AnalystFIELD ANALYST- •Taxes
- •Operating Expenses
Pipeline Value
—DirectDIRECT- •Taxes
- •Operating Expenses
Update
—0 corrected, 1 inferredinf_4- •Taxes
- •Operating Expenses
The portfolio view runs on the field-level decisions above.
Built for the real portfolio, not the demo folder.
LeaseLight runs portfolio reports as structured tables, not one-off chat answers. It can group, sort, calculate, and export findings across hundreds of leases while preserving source links on each material cell.
For ASC 842 schedules, payments, disclosure, and compliance reporting.
System of record after terms are known: dates, documents, contacts, workflows, accounting handoffs.
For tracking pursuits, approvals, tasks, and transaction status.
Review layer for messy lease sets: cited exception reports across costs, rights, obligations, conflicts, amendments, and portfolio risk.
LeaseLight encrypts every lease, isolates customer data, never trains on documents, and removes everything end-to-end on delete — PDF, extractions, reports, and chat history.
Plans for portfolio lease review.
Start with a cited portfolio snapshot, then choose the annual plan that fits your lease volume, team workflow, and security requirements. Pricing is built against manual lease review, $150-500 per-lease abstraction, and weeks of analyst or paralegal time.
Annual plans start at $10K.
Core
Focused portfolio reviews and first-pass diligence runs
Professional
Ongoing portfolio review across deal, asset, and operations teams
Enterprise
Larger portfolios with bespoke review cadence and engagement scope.
We review your lease set, show the cited findings, and map the right annual plan to your review volume.
Send one lease. See what's hiding inside it.
LeaseLight returns a source-backed map of costs, rights, obligations, dates, conflicts, and risks, organized into reports your team can act on.